

Station Ridership (November 2019)
Below is a table of the total sum of balanced boardings for the month of November 2019. Balanced boardings are the average number of entries and exits at O-Train stations. O-Train Line 2 ridership is based on Automatic Passenger Counters aboard O-Train Line 2 trains. Average ridership for weekdays and weekends is shown below, broken down by station, rounded to the closest 100. Staff adjust ridership at all multimodal O-Train stations to account for transfers to O-Train Line 1 within fare-paid zones. It is important to note that the figures above for Tunney’s Pasture, Hurdman, Blair, and Greenboro Stations will also capture customers who are using the station to access bus service. For the ridership figures at Bayview Station, the total is a combination of balanced boardings for O-Train Line 1, as calculated with the fare paid zone adjustment factor, and the balanced boarding total for Line 2.
| Station Name | Balanced Boardings | Weekday Average | Weekend Average |
| Bayview | 412,000 | 8,500 | 3,000 |
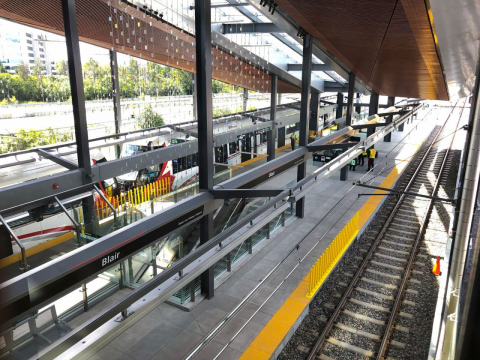
| Blair | 479,000 | 20,100 | 6,300 |
| Carleton | 161,000 | 6,800 | 2,100 |
| Cyrville | 18,000 | 700 | 300 |
| Dow's Lake (Carling) | 51,000 | 2,000 | 800 |
| Greenboro | 98,000 | 4,000 | 1,600 |
| Hurdman | 398,000 | 16,700 | 5,200 |
| Lees | 108,000 | 4,300 | 2,000 |
| Lyon | 275,000 | 12,100 | 2,300 |
| Mooney's Bay | 30,000 | 1,200 | 600 |
| Parliament | 381,000 | 16,700 | 3,400 |
| Pimisi | 89,000 | 3,600 | 1,400 |
| Rideau | 566,000 | 21,400 | 12,900 |
| St-Laurent | 221,000 | 8,700 | 4,400 |
| Tremblay | 24,000 | 900 | 600 |
| Tunney's Pasture | 580,000 | 24,000 | 8,400 |
| uOttawa | 384,000 | 16,300 | 4,700 |
| TOTAL | 4,275,000 | 168,000 | 60,000 |
Ridership data provided by OC Transpo.